One action,
many styles
The inbox contains 10 visual variants of the same button. The priority of an action has to be read from its label.
10 button stylesHow I build a system for a data-dense interface, and the workflow with an AI agent — from the first measurement to a new scenario.
Explore the screens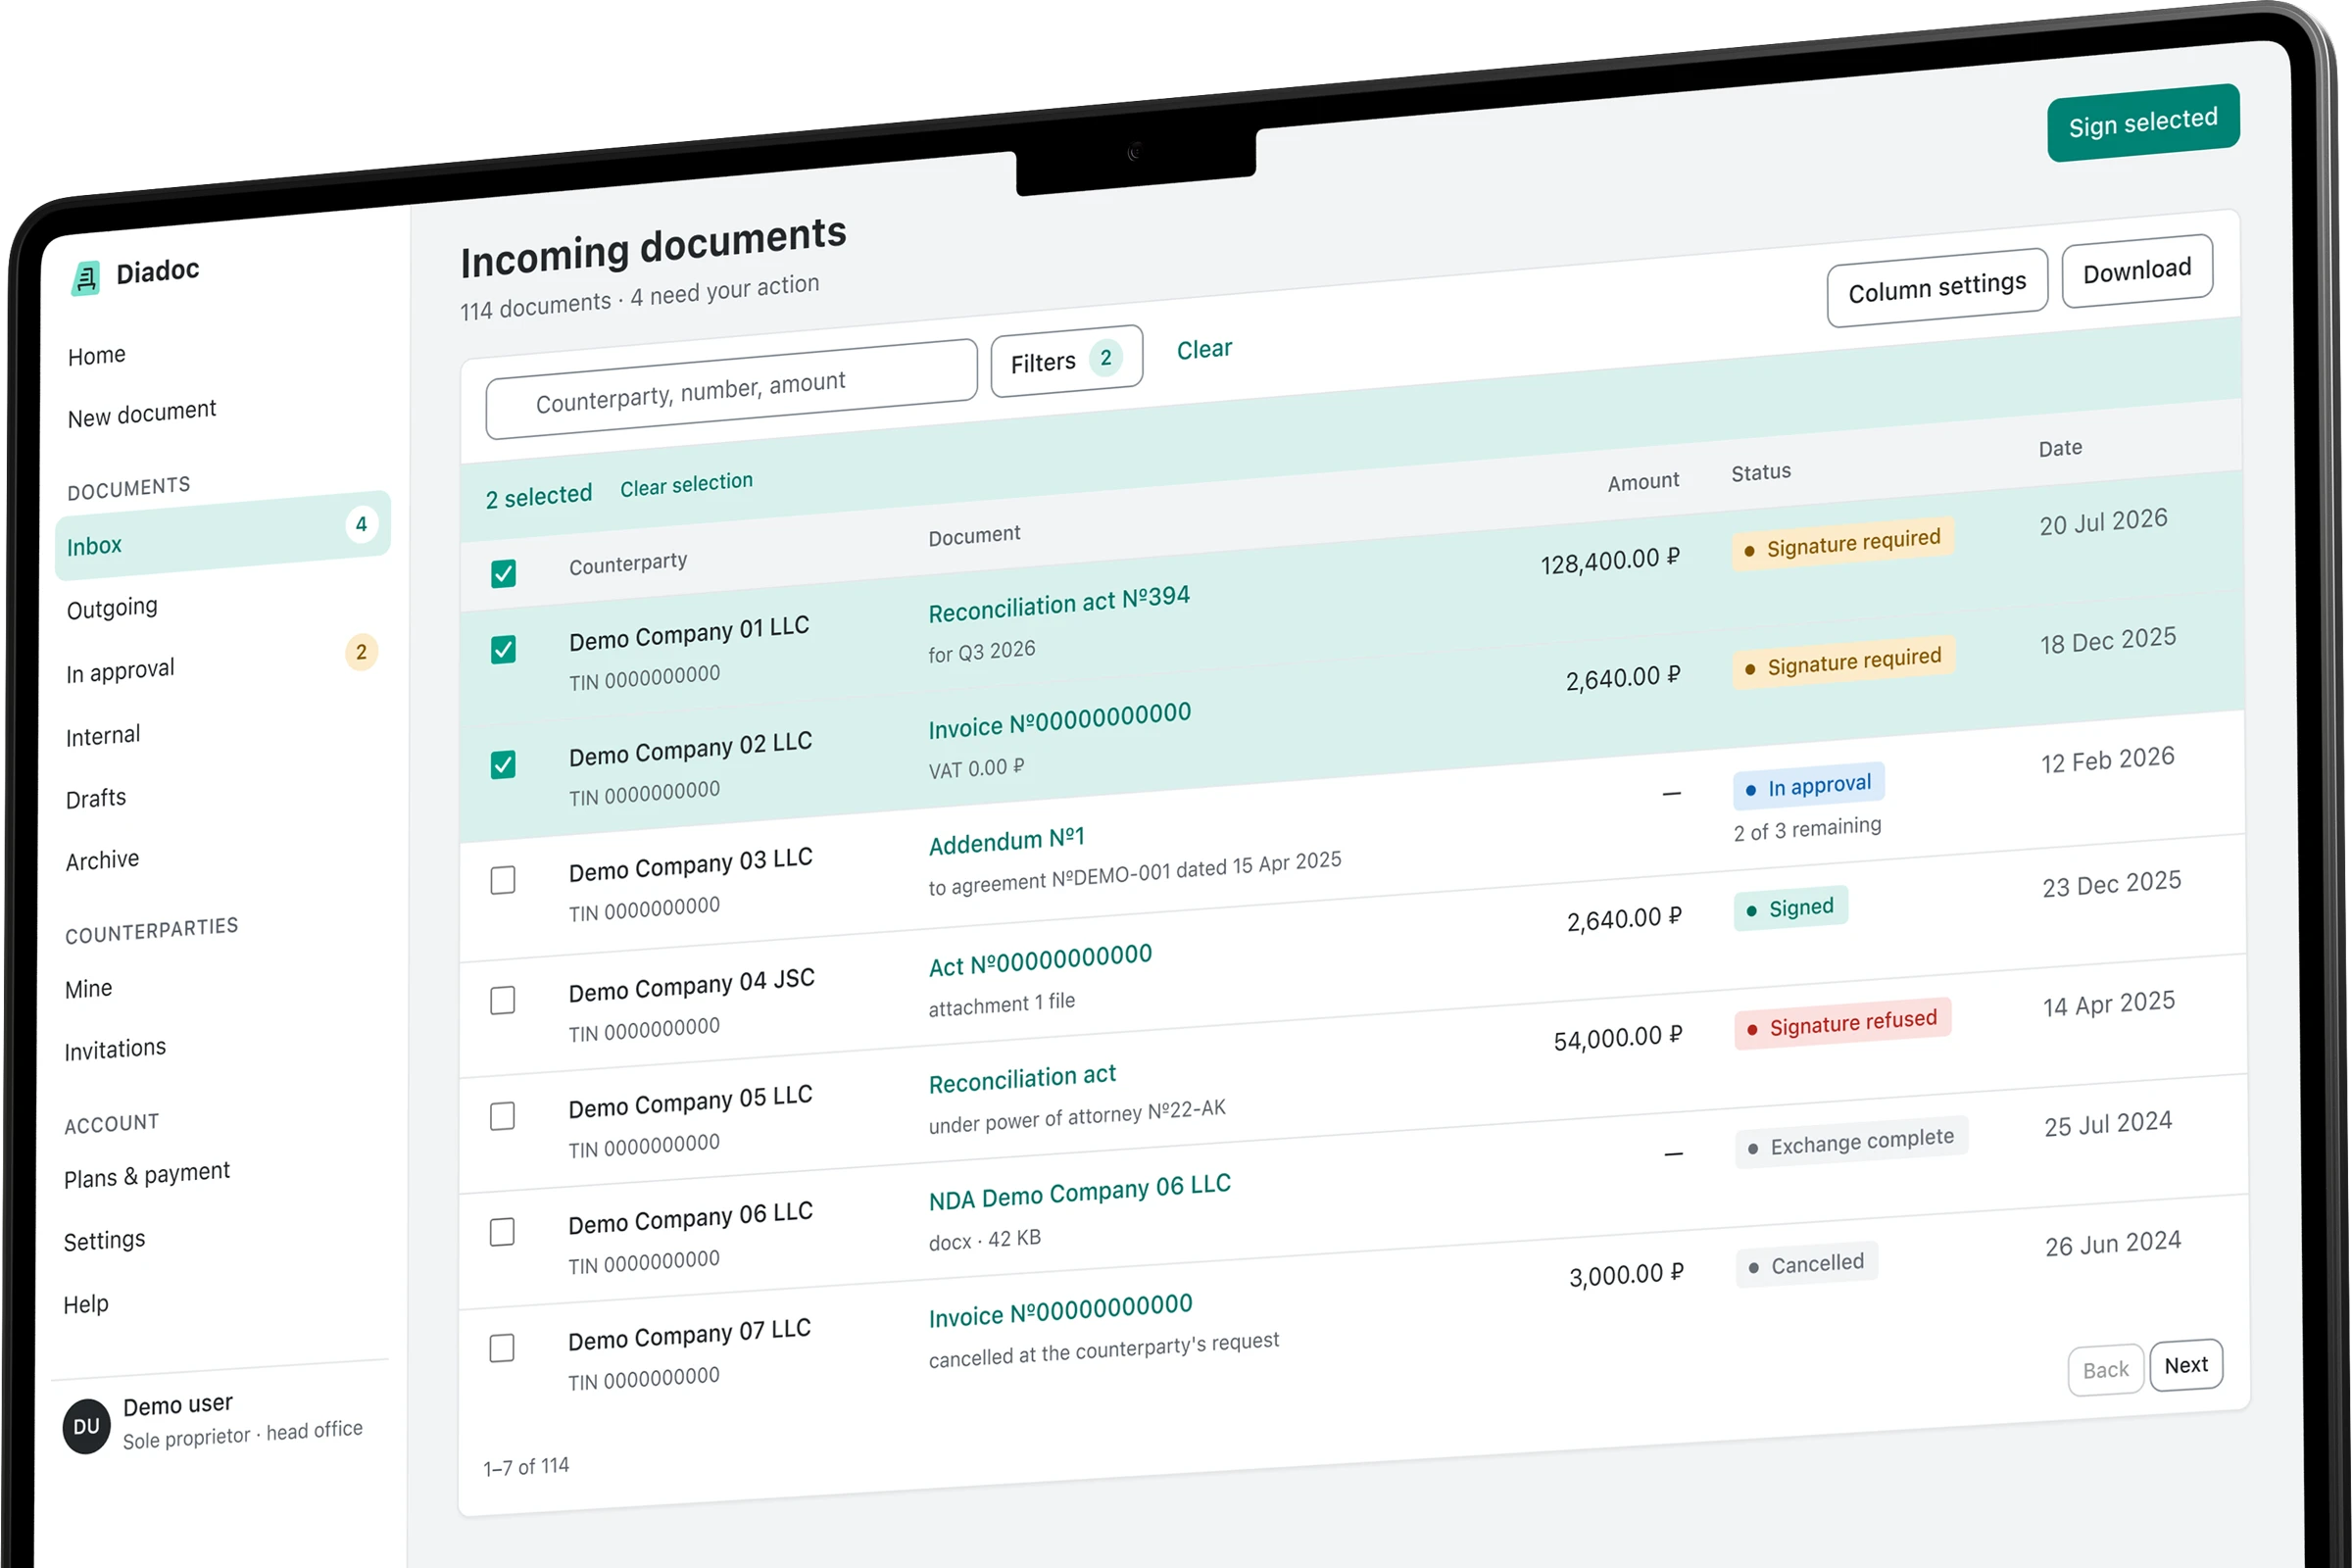
In a document workspace people work with acts, invoices, counterparties and signatures. Details matter: who is waiting for an answer, where the amount is, what is already approved and which action comes next.
An audit of five screens of the original workspace showed the same entities styled differently. My task was to build one shared visual language and test it on the core scenarios.
The starting point is an audit of a live Diadoc session available to a sole proprietor. The case mockups are a standalone prototype with their own visual system. There is no rollout data and no user metrics.
The inbox contains 10 visual variants of the same button. The priority of an action has to be read from its label.
10 button stylesA date changes shape between screens. In the document card the amount loses its thousands separator: 2640.00 ₽.
5 date formatsIn the default send state the script found no labels and no required markers. In the prototype they become part of the field.
0 labels in the default stateEnlarged fragments rebuilt from the audit. They illustrate the rules; they are not screenshots of the original product.
Colour, spacing, radius and state are fixed in tokens. Components use those values, screens are assembled from components. A change to the foundation spreads across the whole prototype.
Open the system showcaseThe primary action, hover and accent use different steps of one palette.
Seven spacing values.
Three radius roles.
From an incoming document to a signature. Eight scenario mockups and a component showcase.
Documents, amounts and statuses are gathered into one table. Selection and the bulk action sit right next to them.
Details, files, history and the approval route are available on one screen. The next action carries the main accent.
Field labels, required markers and errors form a single pattern. The state shown is the one that needs correcting.
Filters expand above the list. Active conditions show as separate tags and keep the context of the search.
The same table pattern and the same statuses applied to a different object. The system transfers between sections.
Plan, limits and invoices use the shared typography. The limit warning carries its own semantics.
An empty list, no results, an error and restricted access: each state explains itself and offers a next step.
The sign-off queue shows the waiting step and its deadline. An expanded route explains whose decision the batch is waiting on.
Palette, typography, geometry and component states in one place. The full showcase opens in its own tab.
The mockups show styling and states. Sending, signing and approving documents are not connected to a live service. Names, organisations and details are demonstration data.
Before a signature, a document can pass through accounting, legal and the manager. A separate queue shows where it stopped and whose decision is needed.
The prototype gained approval batches: waiting time, current step and route. This is a design proposal; its effect on processing time still has to be tested.
Internal check before signing
The route steps needed again, the banner and the key–value pairs were moved from the document card into the shared component base.
In this case the process itself is part of the design: I choose the direction, define the boundaries of each task and insist on reproducible numbers.
The agent turns decisions into code and measurements. The output of every step is an artefact you can open, check and change.
Choosing the task and the object
Visual direction
Requirements for evidence
Measurements and prototype assembly
Extracting shared components
Re-checking the rules
Capture the starting values from computed styles across five screens.
measure.js → before/*.jsonFix the decisions in tokens and build the shared components.
tokens.css → base.cssTest whether the rules transfer across scenarios and onto the new queue.
make.py → 9 mockupsFind the deviations with the same script and fix them in the foundation.
measure.js → after/*.jsonThe first primary-button colour failed the threshold for normal text. Fixing the token changed buttons on every screen.
The result is an HTML/CSS prototype with a shared foundation and saved measurements. The assessment covers interface consistency, not how much faster people work.
Compared on one screen.
No averaging across scenarios.
Combined across the screens studied.
The system showcase is excluded.
Eight scenario mockups
and one component showcase.
The same script walks the DOM and reads computed styles. It checks text and background colours, font sizes and weights, the spacing values in use, radii and control heights. Native controls and default values are partly excluded.
Zero deviations refers to this check. It does not mean full accessibility coverage, every CSS property or every state. The contrast check covers 19 pairs set against a threshold, including the reversed direction of a pair.
"Before" is five screens of a live workspace, "after" is eight scenario mockups. The sets and the volume of data differ. That is why the radius figure above compares one screen, while date formats are reported as a merged sample. Fewer variants does not by itself prove a UX improvement.
Analytics that help people care