Establish scale before exceptions
Placing programme totals beside individual alerts can blur the distinction between overall performance and a specific case.
A regional indicator needs a clear path to the observations behind it. For LensCare, I organised three levels of information: programme performance, patient groups and individual health readings.
Explore the screens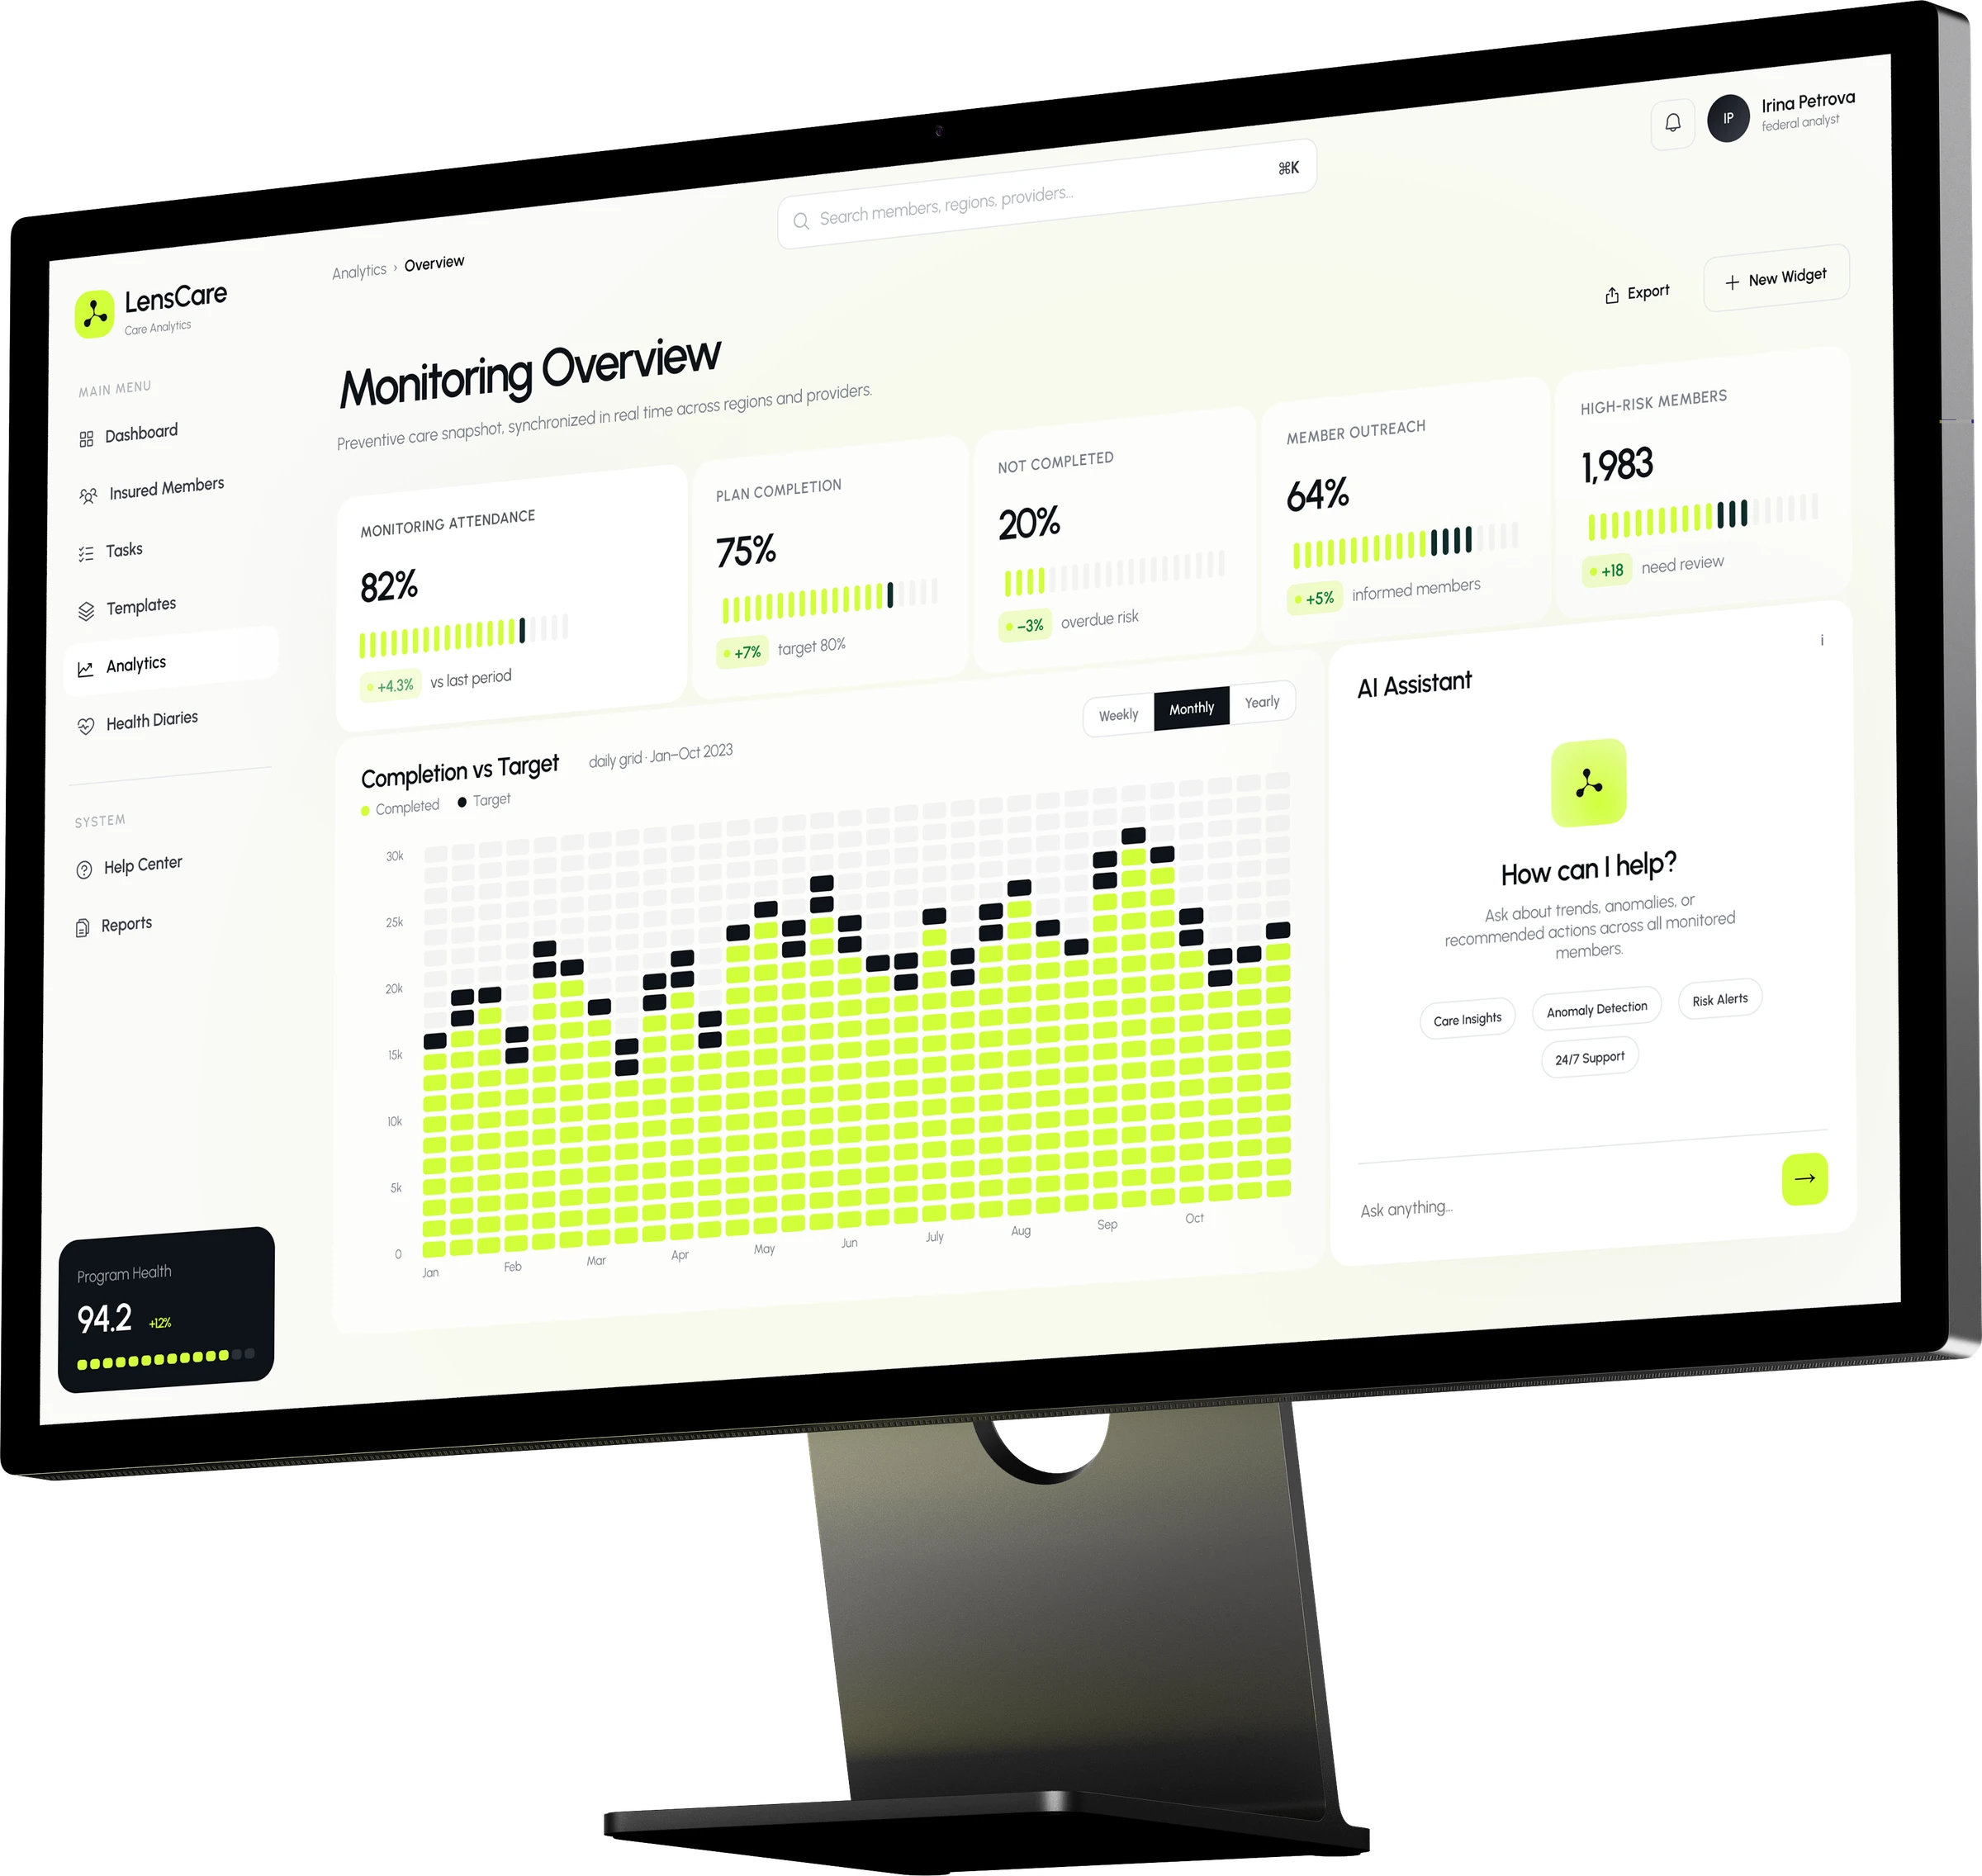
Follow-up care monitoring connects programme oversight with individual observations. Analysts must distinguish plan completion, risk group composition and specific deviations: in the source system, an appointment missed against its due date was as much a basis for a signal as an out-of-range reading. A headline number supports an overview but cannot establish an individual signal’s basis.
The design task was to distribute these questions across levels of the interface. Analytics directs attention, the registry describes the group, and diaries expose a patient’s measurements as the curator’s view rather than a patient scenario. This structure proposes a traceable review process; linked navigation and retained filters are not implemented.
The case is based on a real public health insurance system (2023) covering both the professional contour and the insured person’s cabinet. The LensCare name, identity and demonstration data are changed for publication, and the screens remain a prototype. The patient side of the same system is shown in the HealthHub case.
Three standalone desktop pages; the end-to-end journey is a proposed concept.
Placing programme totals beside individual alerts can blur the distinction between overall performance and a specific case.
An aggregate does not identify its members or show which patient attributes warrant closer inspection.
Risk colour alone cannot explain the direction of change or connect it with a particular measurement.
Placing programme totals beside individual alerts can blur the distinction between overall performance and a specific case.
An aggregate does not identify its members or show which patient attributes warrant closer inspection.
Risk colour alone cannot explain the direction of change or connect it with a particular measurement.
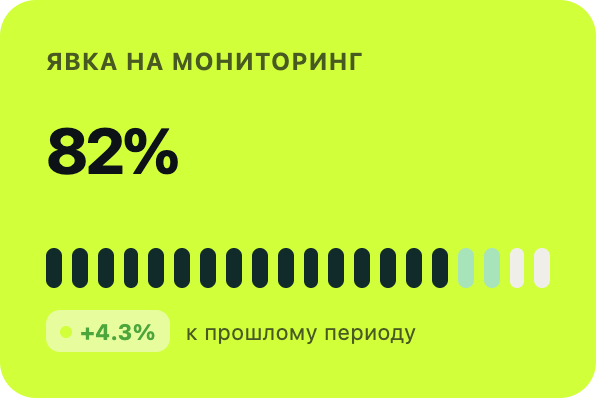
The analytics page moves from KPIs to progress against targets, risk groups and observations needing attention. The sequence progressively narrows the review.
This hierarchy uses vertical space. Urgent observations may require scrolling, so their visibility needs testing in realistic analyst tasks.
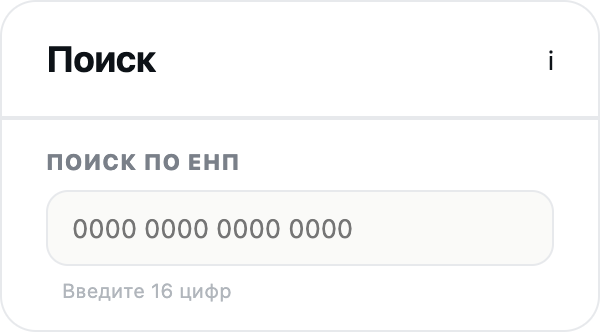
The registry provides an insurance ID search, a filter panel and columns for age, ICD-10 codes, risk level and signals. These attributes structure the proposed narrowing step.
The table assumes desktop working space. Fully functioning filters and carrying context from analytics remain implementation work.
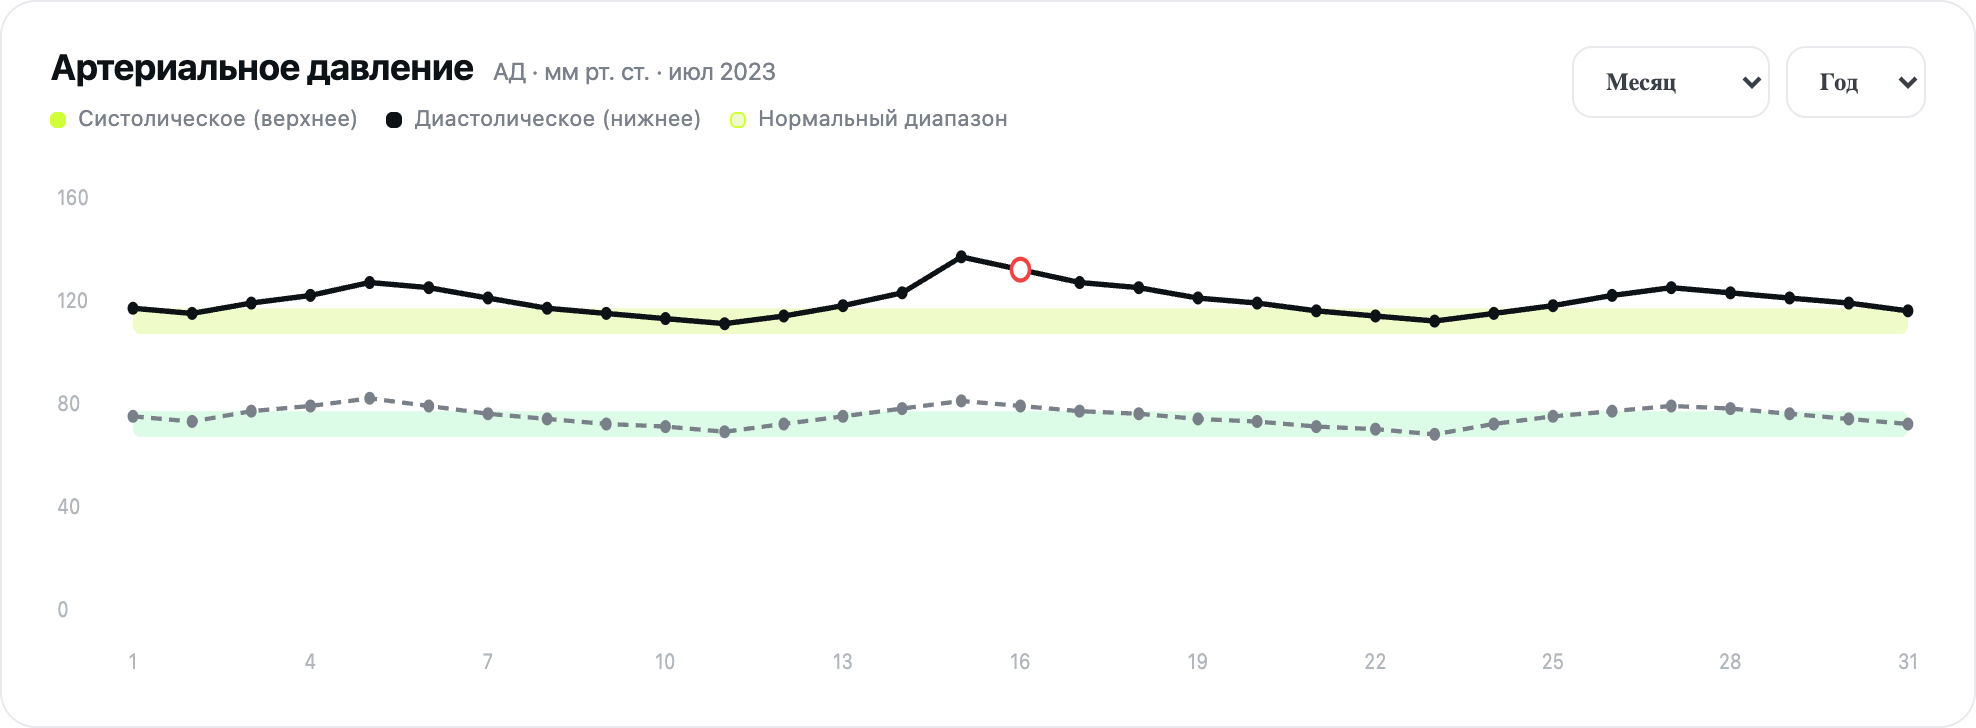
Risk cards compare previous and current states, repeating colour with an arrow and text, so risk-level dynamics read without a legend. Diaries show blood pressure, pulse and glucose with normal ranges and a deviations table.
The ranges and risk states belong to a demonstration. Calculation rules and medical interpretation require separate verification before real-world use.
Fragments of the current Russian-language prototype. The original interface for an evidence-based before/after comparison has not been added.
To add: the original screen, date and comparison conditions.
The palette, component fragments and CSS values from the current prototype. The full system specification and usage rules still need to be added.
Lime #CCFE49 identifies LensCare. Surfaces #EFECE6 and #E4E6E9 with dark #0F1316 underpin tables and analytical cards.
The family declared in CSS. Missing fonts or glyphs use the system fallback.
To add: text roles and the complete type scale.
Selected spacing and corner-radius values from CSS. These examples are not an approved token scale.
The top of the analytics page shows KPIs and progress against the target. Risk groups and observations continue below the preview window.
Search and filters accompany patient rows with diagnoses, risks and signals.
Summary readings and a blood pressure chart with normal ranges. The pulse chart begins at the bottom; glucose and the deviations table sit below the preview window.
Read-only HTML previews of the original Russian-language prototypes. Demo data; personal identifiers replaced. The previews use the original product name "ГИС ОМС" and the logo from the project identity.
Targets accompany progress, ranges accompany readings, and attributes accompany patients. Each block keeps its reference in view.
Three standalone desktop pages; the end-to-end journey is a proposed concept.
Prototype interface
More than a colour code. Text and arrows repeat risk colours. This implemented choice still requires testing within a whole-system accessibility review. The diagram describes the case logic. Working transitions are limited by the current prototype.
The challenge, decisions and prototype are documented. The process history, contributors and intermediate versions still need supporting material.
Visual identity and analytics interface design.
Three standalone desktop pages; the end-to-end journey is a proposed concept.
Scope documented
Decisions and trade-offs documented
Layouts available above
User testing remains a next step
The artefact contains an analytics overview, registry and patient diaries with a shared visual language. It presents three levels of detail and a conceptual route from aggregate information to individual readings.
Artefact inventory
Artefact inventory
Artefact inventory
The numbers describe the prototype’s scope. User impact has not been measured.
To add: baseline, test method, sample and results.
Data is explicitly mocked in the source. Many filter and export buttons only display notifications; the linked journey is not implemented. There is no baseline measurement, so faster analysis or better decisions cannot be established.
In a future test, locate a target deviation and explain what needs attention.
Record identification accuracy, search time and confusion between overall movement and individual signals.
Once pages are linked, trace a group signal to a patient entry.
Check retained selection context, incorrect transitions and whether participants can name the signal’s basis.
Compare a risk change with readings in test diaries.
Record interpretation of direction, ranges and deviations, including a version without colour cues.
What matters today